About Me

Hello! My name is Ngeh Roberto Ayuni, a Cameroonian self-taught data analyst with over three years of expertise in analyzing complex datasets, extracting valuable insights, and driving data-informed decision-making. Detail-oriented, analytical, and skilled in translating data into actionable strategies for business success. Rigorous, organized, ingenious, and creative, I take to heart each solution I implement. I also hold a Bachelor's degree in Management and Entrepreneurship, which gives me an understanding of data's importance in decision-making processes.
To further enhance my analytical skills, I acquired a Google certificate in data analytics and a Business Analytics certificate from Udacity. With these certifications, I expanded my knowledge and strengthened my analytical abilities. I believe in continuous learning and I'm always eager to grow my expertise in data analysis.
I am passionate about data analysis and its ability to drive informed decisions and bring about positive change. I am building this portfolio to showcase my analytical skills and expertise and to be a part of impactful projects that leverage the power of data.
SKILLS:
Spreadsheets, SQL, Tableau, Python, R Programming, Data Collection & Analysis, Decision-Making & Problem Solving, Data governance and security
Excel PROJECTS

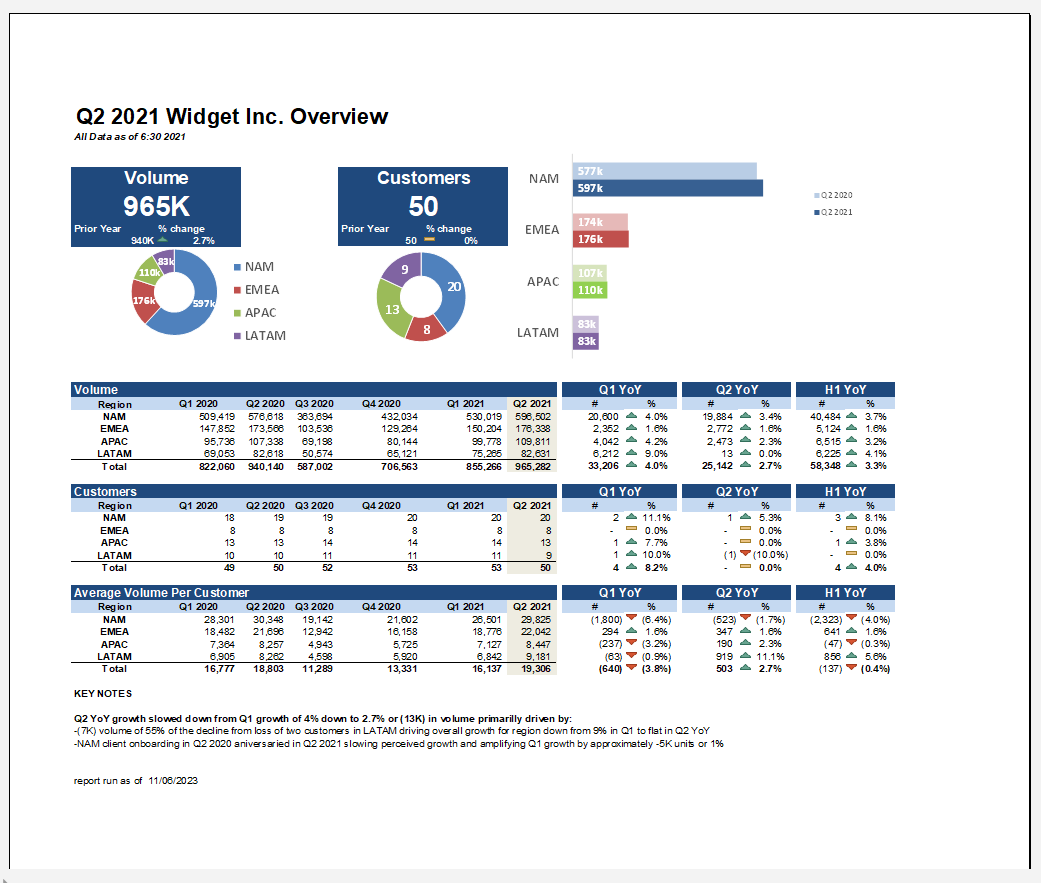
The objective of this project is to determine the business growth rate by analyzing regional sales volumes across NAM, EMEA, APAC, and LATAM, with a focus on Q2 2021.
Document on Github:HERE.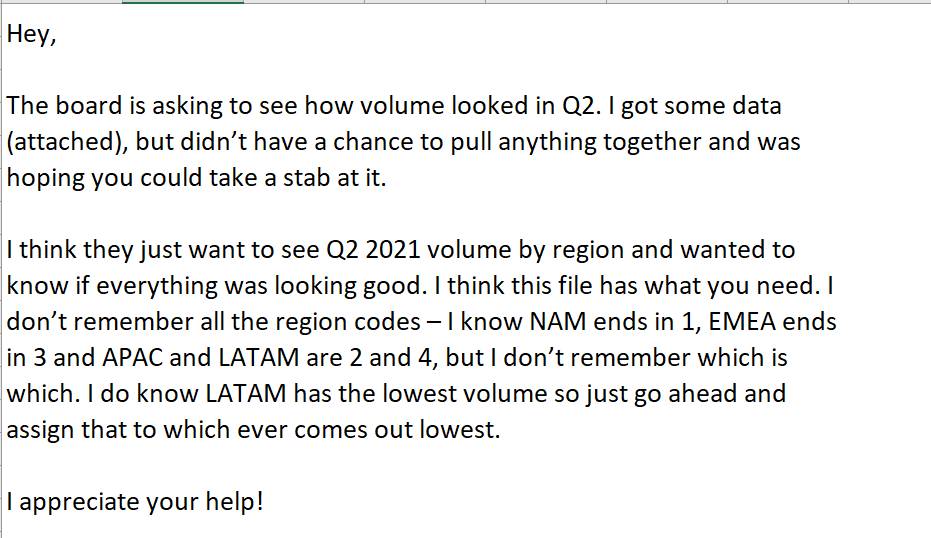
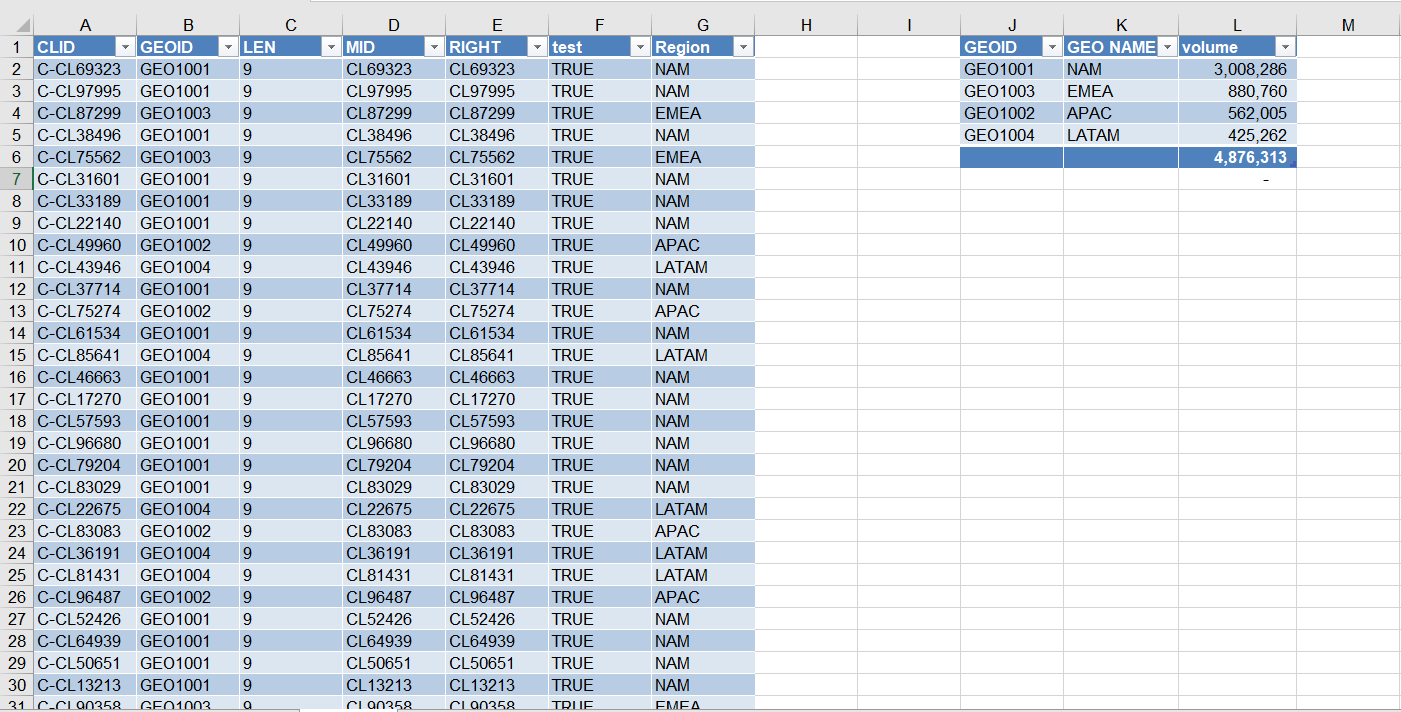
Before cleaning the data, I thoroughly reviewed it and made backup copies of each of the two raw data tabs to ensure their protection and availability during the cleaning process.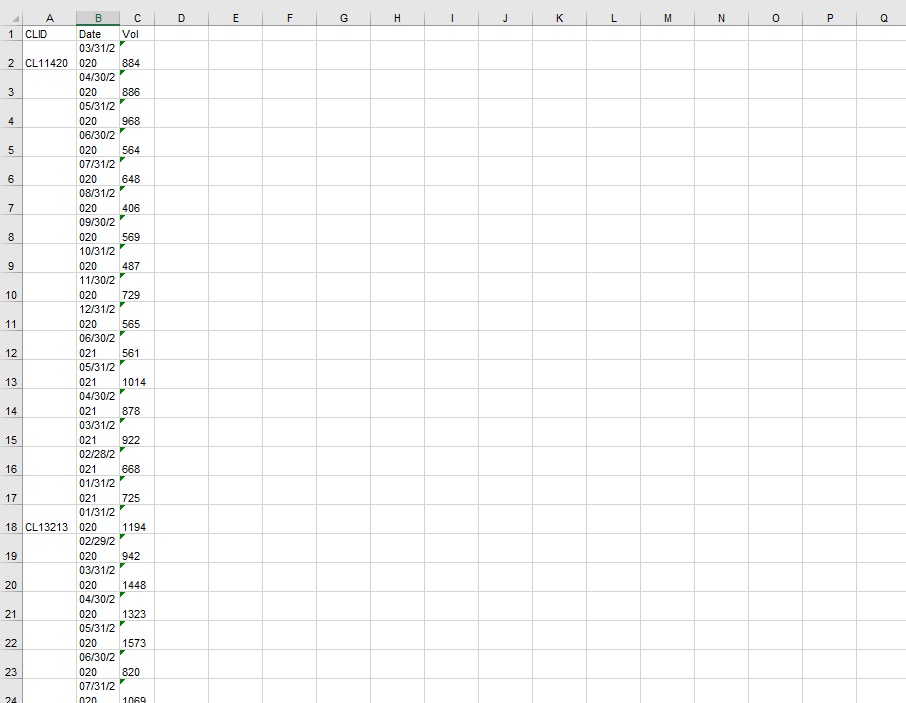
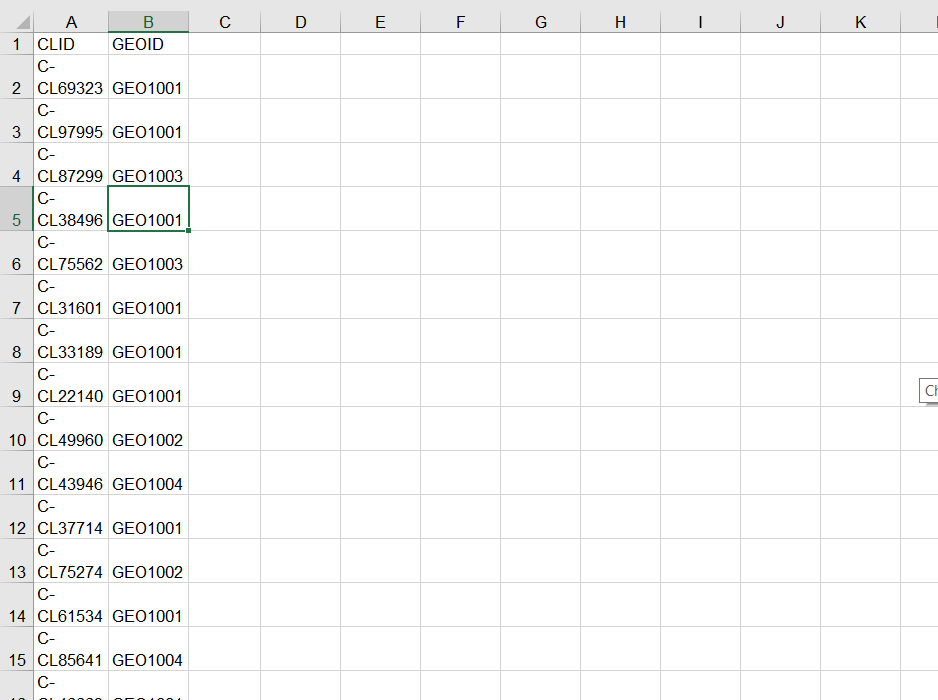
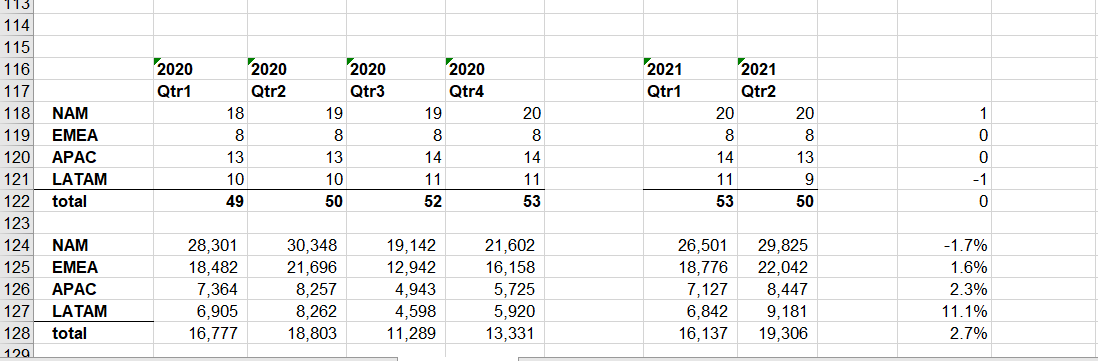
Data Cleaning
After creating backup copies of the two raw data tabs, I renamed them as Volume Data and Geo Data, respectively. The following pictures illustrate the data after the cleaning process is completed.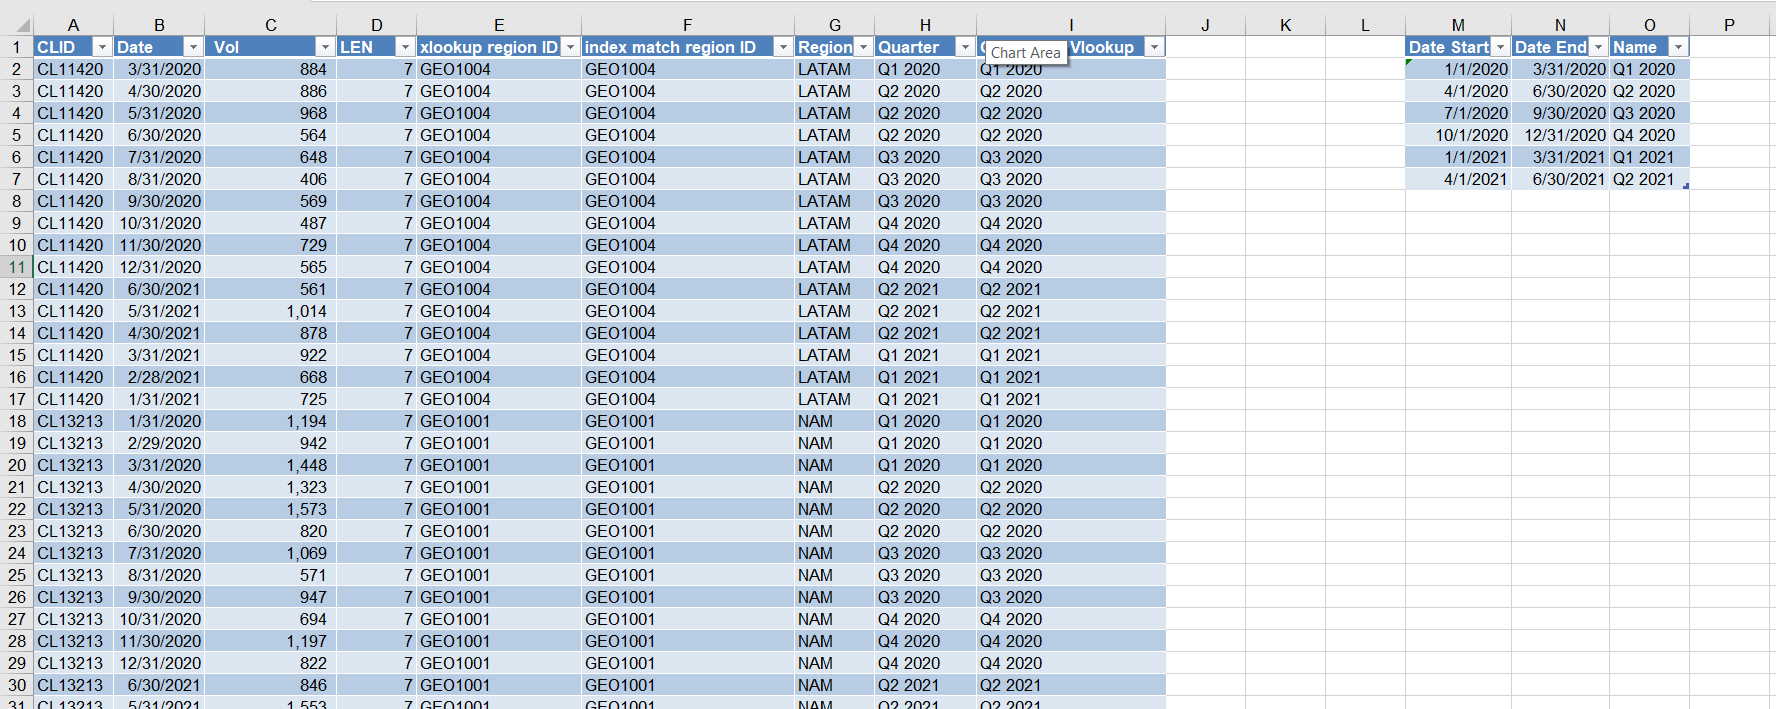
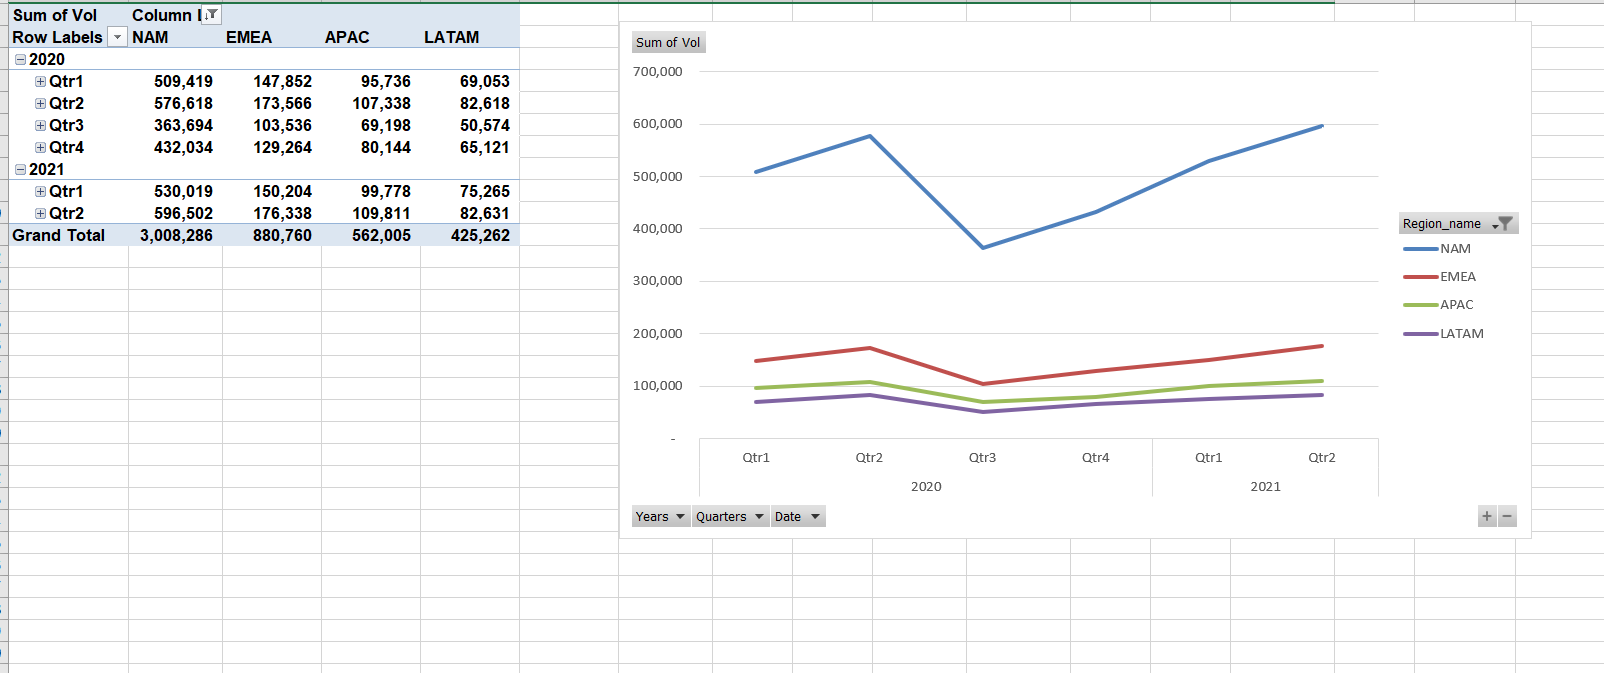
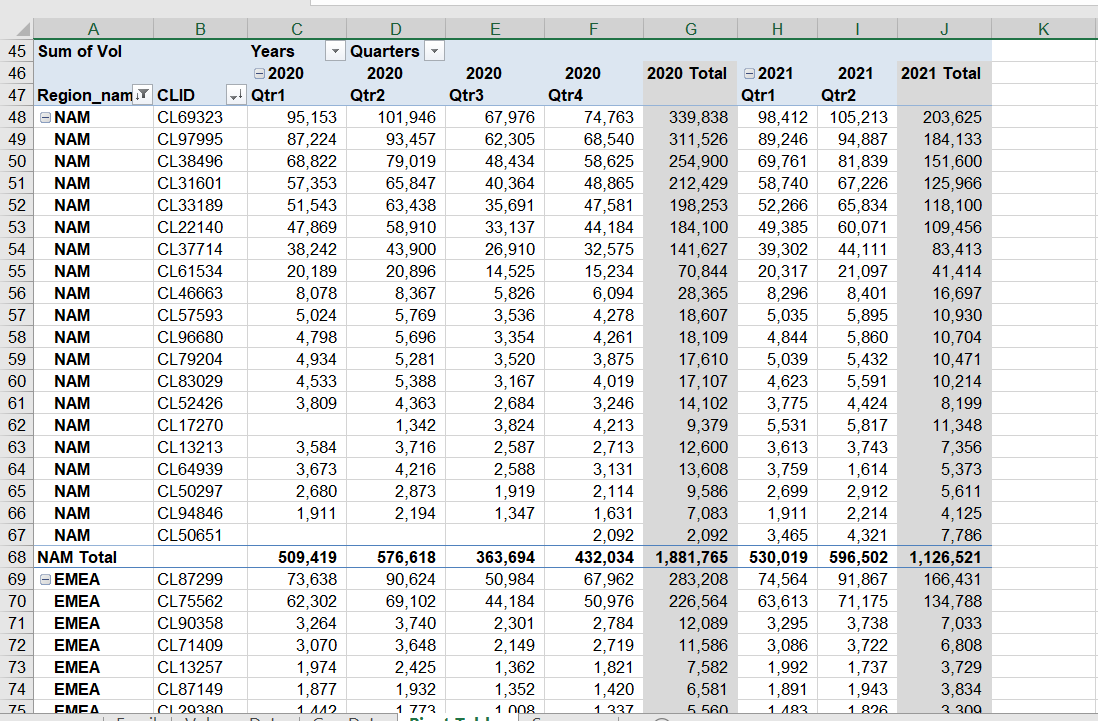
Pivot Table
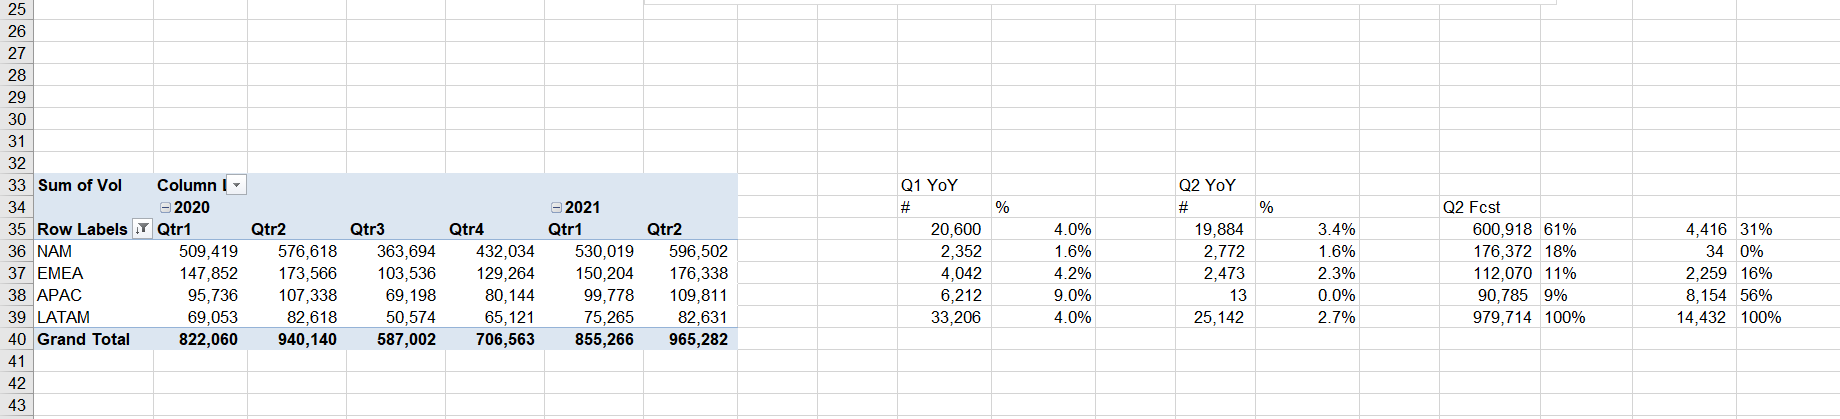
Q2 YoY growth slowed down from Q1 growth of 4% down to 2.7% primarilly driven by:
1. -7% or 7K volume T44 from loss of two customers in LATAM driving overall growth for region down from 9% in Q1 to flat in Q2 YoY
2. -NAM client onboarding in Q2 2020 aniversaried in Q2 2021 slowing perceived growth
Summary
SQL PROJECTS

exploring sales data
The objective of this project was to explore sales data in SQL. I used the RFM analysis to determine how soon a client's last order was (RECENCY), how often the client purchachased (FREEQUENCY), and how much the client spent (MONETARY VALUE). I later created a CASE STATEMENT help me group these clients into "New Customers", "Portential Churners", "Lost Customers", "Active Customers" and "Loyal Customers". I also looked at the Cities with the hieghest sales in each country.
Document on Github: HERE.
TABLEAU PROJECTS

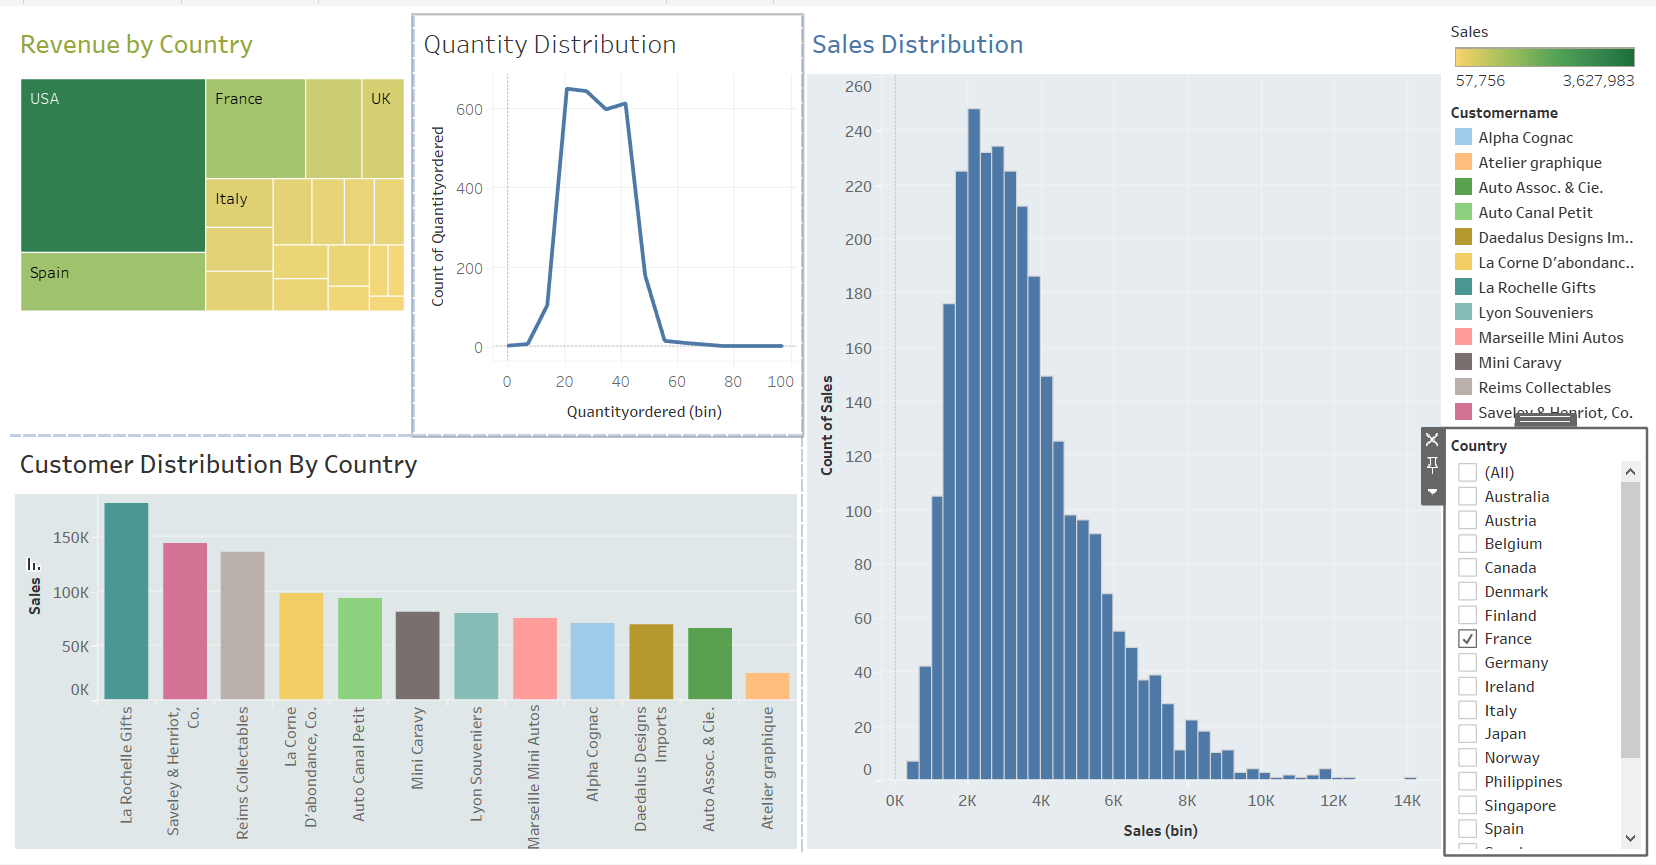
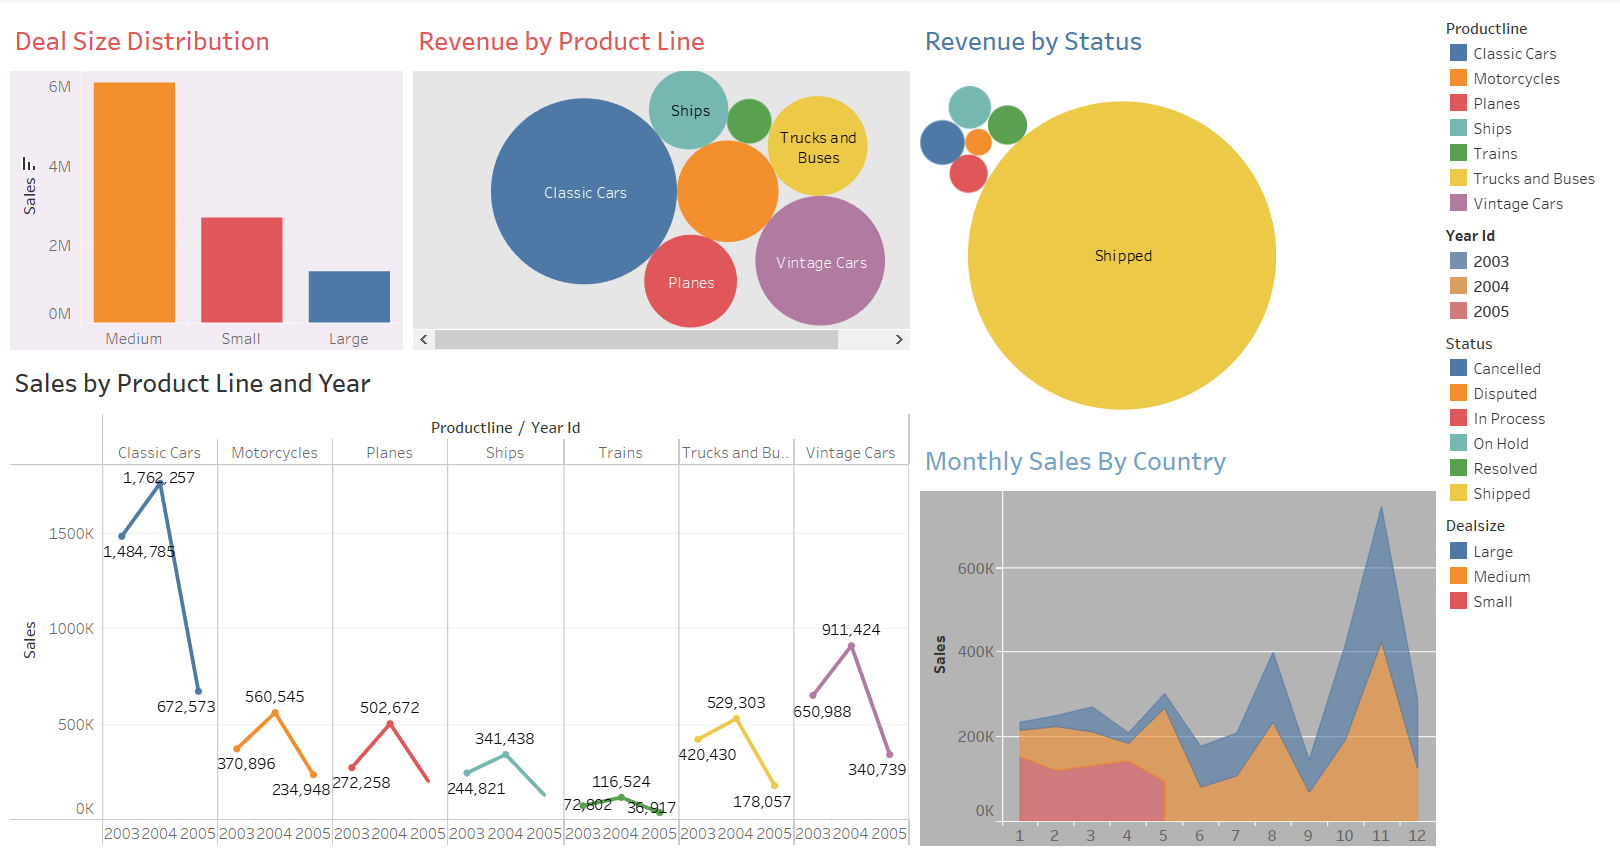
Sales data
The objective of this project is to visualise the sales data and present insights on various metrics such as revenue by country, quantity and sales distribution, customer distribution by country, deal size distribution, revenue by product line, revenue by status, sales by product line and year, and monthly sales by country. The project aims to identify the most profitable clients, their locations, and the products that they are most interested in.
Project on Tableau:
first slide.
second slide.
Contacts
Elements
Text
This is bold and this is strong. This is italic and this is emphasized.
This is superscript text and this is subscript text.
This is underlined and this is code: for (;;) { ... }. Finally, this is a link.
Heading Level 2
Heading Level 3
Heading Level 4
Heading Level 5
Heading Level 6
Blockquote
Fringilla nisl. Donec accumsan interdum nisi, quis tincidunt felis sagittis eget tempus euismod. Vestibulum ante ipsum primis in faucibus vestibulum. Blandit adipiscing eu felis iaculis volutpat ac adipiscing accumsan faucibus. Vestibulum ante ipsum primis in faucibus lorem ipsum dolor sit amet nullam adipiscing eu felis.
Preformatted
i = 0;

while (!deck.isInOrder()) {
    print 'Iteration ' + i;
    deck.shuffle();
    i++;
}

print 'It took ' + i + ' iterations to sort the deck.';
Lists
Unordered
- Dolor pulvinar etiam.
- Sagittis adipiscing.
- Felis enim feugiat.
Alternate
- Dolor pulvinar etiam.
- Sagittis adipiscing.
- Felis enim feugiat.
Ordered
- Dolor pulvinar etiam.
- Etiam vel felis viverra.
- Felis enim feugiat.
- Dolor pulvinar etiam.
- Etiam vel felis lorem.
- Felis enim et feugiat.
Icons
Actions
Table
Default
| Name |
Description |
Price |
| Item One |
Ante turpis integer aliquet porttitor. |
29.99 |
| Item Two |
Vis ac commodo adipiscing arcu aliquet. |
19.99 |
| Item Three |
Morbi faucibus arcu accumsan lorem. |
29.99 |
| Item Four |
Vitae integer tempus condimentum. |
19.99 |
| Item Five |
Ante turpis integer aliquet porttitor. |
29.99 |
|
100.00 |
Alternate
| Name |
Description |
Price |
| Item One |
Ante turpis integer aliquet porttitor. |
29.99 |
| Item Two |
Vis ac commodo adipiscing arcu aliquet. |
19.99 |
| Item Three |
Morbi faucibus arcu accumsan lorem. |
29.99 |
| Item Four |
Vitae integer tempus condimentum. |
19.99 |
| Item Five |
Ante turpis integer aliquet porttitor. |
29.99 |
|
100.00 |